From 1st July 2023, Universal Analytics (UA) will stop processing website and app data, and the latest version of the web analytics service, Google Analytics 4, will completely take over. This is why we have created this guide on using Google Analytics 4 for beginners so businesses can prepare to use the tool.
Although businesses can access their historical data and export reports for at least six months after UA has been replaced, no new data will be processed unless their properties are set up on GA4.
But what exactly is GA4? Why is it so crucial for businesses? Before we go into how Google Analytics 4 works, we will explain what the tool does and how it can benefit you and your business.
What is Google Analytics 4?
Google Analytics 4 is a web analytics service offered by Google, which provides businesses with insights on their websites and apps.
The data that GA4 gathers helps to build a picture of a user’s journey, i.e., how they interacted with content or the steps they took before a conversion. Additionally, the tool allows businesses to create reports, enabling them to analyse the results from their marketing efforts to be strategic when planning future campaigns.
The type of insights businesses can track includes multiple aspects, such as where their website traffic is coming from or the devices used. You can monitor social media activities, track mobile app traffic, identify trends, and even integrate the software with other data sources (CRMs, WordPress, Facebook, and Shopify).
Will Google Analytics 4 be Better than UA?
There have been many alterations made to improve the analytics service that Google offers but also to keep up with the industry and global changes.
Previously, there was a lot of observable data available, mainly thanks to website cookies. However, people have become more concerned about their privacy when searching the internet. More global data regulations have caused gaps in the data gathered by analytical tools.
Google recognised the gaps in data and the problem it caused businesses, which is why UA has evolved into GA4 to provide more consistent data for businesses to analyse.
Below are a few of the new GA4 features or areas of the analytical service that have improved:
1. Any Event Can Be Labelled As A Conversion
UA only classes ecommerce transactions or completed actions as conversions. In contrast, GA4 allows businesses to label any event as a conversion if they deem it important to track.
It is worth noting that a user can only add 30 conversions per property.
2. Tracks Users In A Single Journey
GA4 allows businesses to add multiple web and app streams (sources of data) to each property. It can track users in a single journey over multiple devices, bringing together data from different sources and platforms so that all of the information is considered. This is known as a unified data model.
The data will be more accurate, with a single user being recognised as such rather than their data being duplicated, even if they use multiple devices to access the website/app. Cross-device tracking also helps businesses to see which data sources are bringing in the most users, engagement, and conversions.
3. Less Session-Based, More Event-Based
The data collected by GA4 is less focused on sessions and pageviews compared to UA and more focused on events.
An event allows businesses to measure a distinct user interaction on a website or app. For example, loading a page, clicking a link, and completing a purchase are all interactions businesses can measure with events.
A session is a group of user interactions on a website within a certain time frame. A session begins when a user lands on a business’s tracked webpage and will end when they click on another page. By default, a session times out after 30 minutes of no activity; however, this can be extended.
In GA4, you can still see session data, but it collects user interactions as events. This allows businesses to see pieces of information that add further context to the event or user.
4. Lifecycle Reports
UA only has the Acquisition report, but GA4 has several reports to provide a more in-depth and visual aspect of a user’s lifecycle.
The reports available on GA4 include:
- Acquisition
- Engagement
- Monetization
- Retention
These reports allow businesses to view more data, particularly after a customer has been acquired, which is where the Engagement, Monetization, and Retention reports help.
5. Updated Privacy Controls
GA4 allows more control of privacy settings. For example, there are features such as cookieless measurement and behavioural and conversion modelling.
Additionally, there are new metrics in GA4, such as:
View Per Session
Tracks the number of webpages or app screens people view during a single visit.
Average Session Duration
Measures the time people spend on the website.
Should I Switch To Google Analytics 4?
If you have a property on UA, it is advisable to set up a Google Analytics 4 account and switch over to a GA4 property as soon as possible. This will prepare you for the change from July 2023, when no new data will be processed by UA.
While you run your GA4 property alongside the UA property, it will help to strengthen your learning and allow GA4 to gather data which will enable you to build a bigger picture for future analysis.
How To Use Google Analytics 4
Before we begin to explain how to set up a Google Analytics account, we will detail what is meant by ‘property’ and ‘data stream’.
When we mention ‘property,’ we refer to the business’s name or brand. When we mention ‘data stream’, we refer to the data source, such as the website, app, social media page, etc.
For each app or website that your business has, you should put it under a new Data Stream. For example, if your business has one website and two apps, you should have one property and three data streams.
Setting Up Google Analytics 4
Below are simple steps to create a GA4 account if you do not already have an existing UA account or to upgrade.
How To Create A Google Analytics 4 Account
- Login to your Google account
- Go to analytics.google.com
- Click ‘Start Measuring’
- Create the name of your account (usually a business name)
- Click ‘Next’
- Provide a property name (again, usually a business name)
- Select the appropriate time zone and currency
- Provide your website’s URL
- Select the option to create a GA4 and UA Property (you must click ‘Advanced Options’ and switch the toggle to ‘On’)
- Provide the details of your business, such as your industry
- Click ‘Create’
- Accept the Google Analytics Terms Of Service by checking the relevant boxes
- Click ‘I Accept’
How To Upgrade To GA4 If You Have An Existing UA Account
- Click ‘Admin’
- Under the ‘Property’ column, click ‘GA4 Setup Assistant’
- Click ‘Get Started’
- Click ‘Create Property’
- Click ‘See Your GA4 Property’
- Under ‘Tag Installation’, click the arrow (>)
- Under ‘Data Stream’, click the arrow (>)
- In the top right corner, it should display the Measurement ID for GA4.
How To Configure GA4 Event Tracking
Before you can configure event tracking, you need to set up and install Tag Manager and then place the Tag Manager snippets on your website.
The GA4 Configuration tag ensures that data flows from a business’s website to Google Analytics without having to write pieces of code. For every page a business wants to track and collect data, they must create a tag.
To set up the GA4 Configuration tag:
- Go to Google Tag Manager
- Click ‘Tags’ and ‘New’
- Provide a name for the tag
- Enter your ‘G-’ ID in the Measurement ID field
- Click ‘Trigger’ and select ‘Initialization all pages’ trigger
- Click ‘Save’
Creating New Events In GA4
As previously mentioned; an event allows you to measure a user’s interaction on a website/app.
Some events are automatically tracked by GA4, such as:
- First_visit
- Page_view
- Session_start
- User_engagement
A few more events are automatically tracked if Enhanced Measurement is activated.
The data gathered from event tracking is used to create the dimensions and metrics. ‘Dimensions’ answer the questions, ‘who, what, and where’, and ‘Metrics’ answer the questions ‘how many’.
Businesses can also set up new metrics and dimensions to enable them to customise what they track according to what they deem important to measure for their business.
To create a new GA4 event:
- On the ‘Events’ page, click ‘Create Event’
- Select the data stream that contains the existing event
- Name your new event
- Enter the conditions you wish to use
- Select whether you want to modify or copy the parameters for your new event
- When the conditions for your new event match an existing incoming event, you will start to see data from your new event on the ‘Events’ report.
For dimensions, the answers are given in words and can be used for both the ‘User’ or ‘Event’ scope (category).
For metrics, the answers are numbers and can only be used for an ‘Event’ scope. A metric cannot be put in the ‘User’ scope because this category answers questions about the user, such as demographics, which must be displayed as a worded response.
Track Your Conversions
A conversion is when the user completes the desired action stipulated by a business. The action can be anything that is considered valuable to a business, such as a user purchasing a product or even as simple as downloading a form or signing up for a newsletter. Regardless of whether it comes through SEO or PPC or any other channel, it’s important you pick up on this data correctly.
‘Conversion’ reports display the event data that is automatically collected by GA4. However, for any specific conversions that a business wishes to track, they will have to add these.
You can add up to 30 conversions for each property in addition to the ones that GA4 automatically marks as conversions.
Setting Up Events As Conversions
- On the ‘Events’ page, click the toggle to the right of the listed events
- Once you have selected the event as a conversion, it will be included in the ‘Conversion’ report
As a digital marketing agency that is committed to boosting the online presence of many businesses, Fly High Media offers several services, such as Conversion Rate Optimisation, to help increase the number of website visitors that convert into customers.

How To Get The Most From Your Google Analytics 4 Reports
There are different reports available on GA4, all of which enable a business to assess their website/app data in a format that suits their objectives.
In the right corner of each reporting page on Google Analytics 4, there are several icons. This is where you will find the ‘Share report’ icon, which enables you to share any of the reports with your team.
Realtime Report
UA already collects a business’s real-time data for their website/app; however, it only displays the number of users within the last 5 minutes, whereas Google Analytics 4 displays the number of users within the last 30 minutes.
This extended amount of time provides businesses with a wider overview of up-to-the-minute data, allowing them to make more informed decisions, which is particularly useful when they are tracking how a new marketing campaign is performing.
The features of real-time reporting allow you to:
- Monitor activity on your website or app as it is happening (per minute)
- Have a better understanding of how users enter the conversion funnel, and their behaviours
- Track the number of people on your website/app in the last 30 mins
- See where your users are coming from, i.e., source, medium, or campaign
- Compare your new users against existing ones
- Monitor the events that are triggered
- Track the conversions that are completed
How To Access The Realtime Report
- In the left menu bar, click ‘Reports’
- Click ‘Realtime’
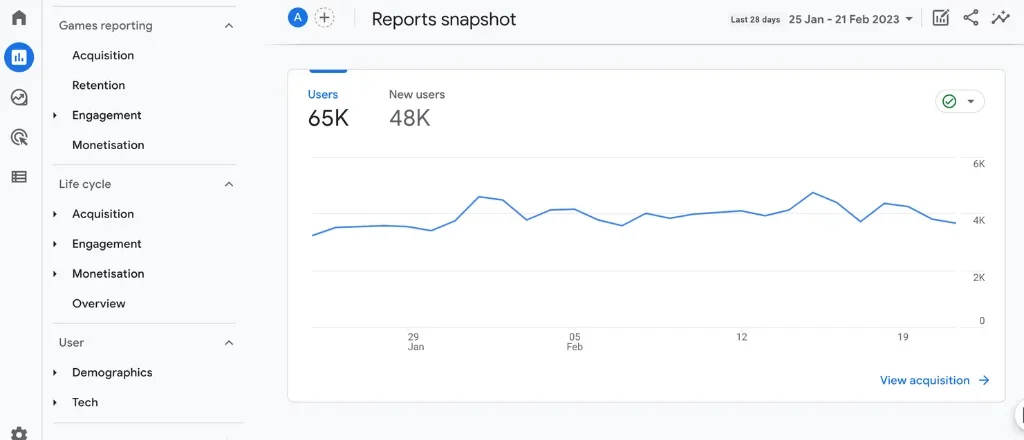
Life Cycle Report
The ‘Life Cycle’ reports are focused on a user’s journey, helping businesses to understand each stage, from ‘Acquisition’ to ‘Retention’.
‘Acquisition’ reports help you to discover how you have acquired new users by providing information on where they have come from, such as the channel, i.e., organic or paid.
‘Retention’ reports can help you to understand how valuable a user is, displaying how frequently they view your website, for how long, and the revenue they generate.
‘Engagement’ reports display data on how users engage with your website, i.e., their average engagement time, and the engagement sessions per user. Additionally, this is the section where you can track events and conversions.
‘Monetisation’ reports provide an overview of a business’s revenue and a detailed breakdown of how products/services are performing, according to the average spend per person and the number of transactions made per person.
How To Access The Life Cycle Reports
- In the left menu bar, click ‘Reports’
- Select either ‘Acquisition’, ‘Retention’, ‘Engagement’, or ‘Monetisation’
Use Explorer Reports Through The Analysis Hub
On Google Analytics 4, the Explore section offers a variety of reports to provide an in-depth, alternative view of the data gathered from a business’s website/app. It is the same data that is available within the other reporting sections; however, it is displayed in a more visual format to allow businesses to uncover new trends.
To display your data, the following techniques are available in ‘Exploration’:
1. Free-form Exploration
Presents your data in a crosstab layout, where the rows and columns can be arranged to suit the business. Additionally, data can be measured in a visual format, i.e., via bar charts, pie charts, and scatter graphs.
2. Cohort Exploration
Allows you to understand the behaviours of segmented groups, according to their common attributes. A group (cohort) is identified when the users share the same characteristic, i.e., they became new users on the same date.
3. Funnel Exploration
Enables you to visualise the steps your users take before completing a key task or conversion. Additionally, you can better understand how users enter the funnel and where they drop off.
4. Segment Overlap
Lets you compare up to three user segments to see how those segments overlap and relate to each other. ‘Segment Overlap’ effectively enables you to compare and isolate audiences under complex conditions.
5. Path Exploration
Similar to ‘Funnel Exploration’, it enables you to visualise the steps users took through your website/app; however, where ‘Funnel Exploration’ follows a predefined path, ‘Path Exploration’ is free-flowing, meaning you may discover paths that you weren’t aware of before, i.e., different stages to a user’s progression.
6. User Lifetime
Discover the value of a user by exploring their behaviours. Here, you can uncover key information about a user, such as the last time they purchased a product/service from your website and who is expected to be more valuable based on their historic purchases.
How To Access The Exploration Reports
- In the left menu bar, click ‘Explore’
- Select an ‘Exploration’ report
How To Create A GA4 Exploration
- Click the plus icon (+) to create a blank exploration. For a quicker alternative, select a template
- To begin exploring your data, select a technique
- From the ‘Variables’ panel on the left, add items to the dimensions and metrics sections
- Drag and drop the ‘Dimension’ and ‘Metrics’ to the ‘Tab Settings’ panel
- To refine the data, add segments and filters
Attribution
Lastly, in the ‘Advertising’ section of Google Analytics 4, you will find ‘Model Comparison’ and ‘Conversion Paths’ under ‘Attribution’.
The ‘Model Comparison’ section is where businesses can compare attribution models to decide which is most suitable for them. An attribution model is a data-driven algorithm that determines the touchpoint that gets the credit for a conversion.
The ‘Conversion Paths’ section is where a business’s preferred attribution model is used; it allows them to see data differently to, hopefully, provide deeper insights and reveal how successful certain aspects of their campaign are.
The GA4 attribution models are:
- Last Click Attributes 100% of the credit to the last touchpoint in the user’s journey just before they made the conversion.
- First Click Assigns 100% credit to the first touchpoint in the user’s journey.
- Linear Distributes the credit for the conversion equally across all of the user’s touchpoints.
- Position-Based Attributes 40% credit to the first and last interaction, and the remaining 20% credit is distributed evenly to the middle interactions.
- Time Decay Gives more credit to the touchpoints that happened closer in time to the conversion.
- Data-Driven Attribution Gives credit for conversions based on how users engage with various ads before converting.
We hope that this guide on Google Analytics 4 will be useful to you when you set up your GA4 account and come to create reports to analyse your website/app data.
Do you need to increase your website traffic? Fly High Media can help. With our team of experts, we can optimise your website to achieve effective results. For further information on our services, contact us today.
Contact Fly High Media Today!


